This page looks best with JavaScript enabled

TIG Stack on Raspberry Pi 4

 ·  ☕ 7 min read  ·  🦆 Jeremy
Deployed dashboard:

Since the beginning of the Covdi-19 epidemic, lot of us got much more time at home and it was a “good” occasion to work on projects we had put aside. That is my case, especially with those Raspberry Pi 4 which were left untouched for too long!

So I decided to gather some projects and topics which I wanted to invest time:

  • Install a TIG stack on Raspberry Pi
  • Using CSV plug-in for Telegraf
  • Continuing to work with Ansible
  • Exploring the new Grafana major version (7.0)
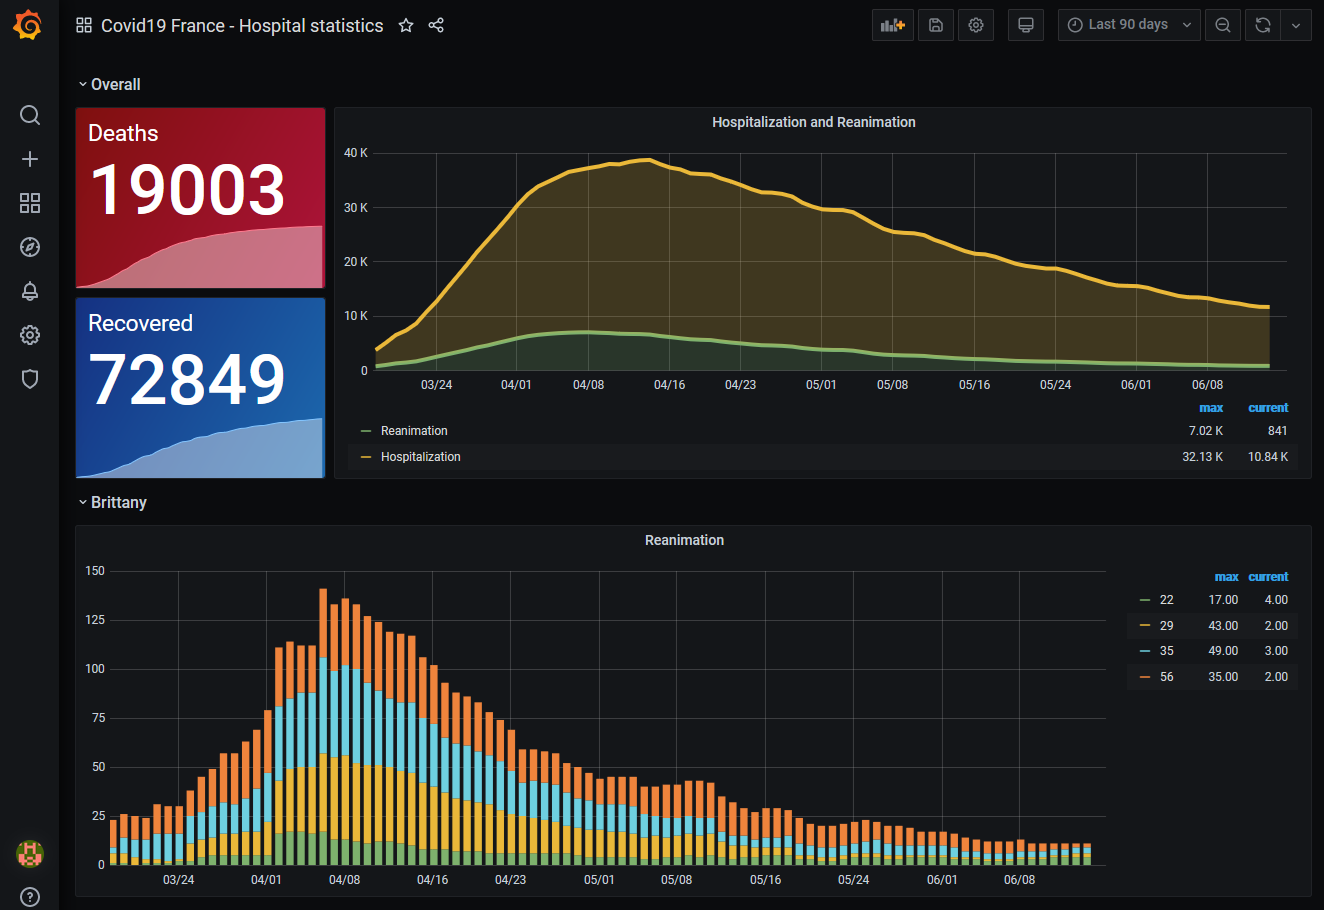
  • Visualize French Covid-19 data made available by the government

So you got the idea, I will describe an Ansible Playbook to deploy the TIG Stack allowing us to visualize the Covid-19 data on a Raspberry Pi 4. The data are coming from the French government and are available here: https://www.data.gouv.fr/fr/datasets/donnees-hospitalieres-relatives-a-lepidemie-de-covid-19/.

They are processed by Telegraf, then recorded in an InfluxDB database to be vizualized in Grafana.

Prerequisites

  1. You will need a Raspberry Pi, if you don’t have one available, you can use an Ubuntu VM.

  2. I will assume you have an Ansible control node in place. If you don’t, you can follow the steps from this article: https://plop.bzh/en/ansible/ansible-wsl-01/

  3. It will be easier if you copy your SSH key:

    1
    
    ssh-copy-id ubuntu@192.168.0.18
    

I’m currently using Ansible 2.9.9 in a VirtualEnv:

1
2
3
4
5
6
7
(ansible) jlg@DESKTOP-N97SPSR:~/ansible/ansible-pi-tig$ ansible --version
ansible 2.9.9
  config file = None
  configured module search path = ['/home/jlg/.ansible/plugins/modules', '/usr/share/ansible/plugins/modules']
  ansible python module location = /home/jlg/venv/ansible/lib/python3.6/site-packages/ansible
  executable location = /home/jlg/venv/ansible/bin/ansible
  python version = 3.6.9 (default, Apr 18 2020, 01:56:04) [GCC 8.4.0]

Project files

The project is available on GitHub.

Project structure

Here are the files in the project:

 1
 2
 3
 4
 5
 6
 7
 8
 9
10
| group_vars\
|   | all.yml
| files\
|   | dashboard-covid19-FR.sjon
|   | donnees-hospitalieres-covid19-2020-06-14-19h00.csv
|   | telegraf.conf
| templates\
|   | dashboards.yml.j2
| inventory.ini
| playbook.yml

Inventory

Inventory file:

1
pi-tig ansible_host=192.168.1.21

Then we can check the node access:

1
ansible pi-tig -i inventory.ini -m ping -u ubuntu

Expected result:

pi-tig | SUCCESS => {
    "changed": false,
    "ping": "pong"
}

Variables

Because the main goal of the project is to stay simple and readable, all the variables are set in a single group_vars\all.yml file. This way, they will be automatically imported during the Playbook execution.

1
2
3
4
5
influxdb_dbname: covid19

grafana_datasource: "{{ influxdb_dbname }}"
grafana_dashboards:
  - "dashboard-covid19-FR.json"

Playbook

As is often the case with Ansible, there are several options when it comes to chose a Playbook structure. To make it easier to understand, I chose to do a single Playbook with 4 Plays in it. There were other possibilities, like:

  • A single Play: as all three components are deployed on the same node with the same user and with a unique variable file.
    • The Playbook would be less readable though
  • Roles: creation of three roles for Grafana, InfluxDB and Telegraf.
    • This may lead in a too complex project compare with the simplicity of the actions needed.
    • We will have the opportunity to deal with roles in a later article regarding the TIG stack !

Prerequisites

Playbook and first Play creation’s:

 1
 2
 3
 4
 5
 6
 7
 8
 9
10
11
12
13
14
15
16
17
18
19
20
21
22
23
24
25
26
27
28
29
30
---
- name: Prerequisites
  hosts: pi-tig
  remote_user: ubuntu
  become: true
  tasks:
    - name: Set timezone to Europe/Paris
      timezone:
        name: Europe/Paris

    - name: Add InfluxData Apt key
      apt_key:
        url: https://repos.influxdata.com/influxdb.key
        state: present

    - name: Add stable InfluxData Apt repository
      apt_repository:
        # repo: "deb https://repos.influxdata.com/{{ ansible_facts['distribution']|lower }} {{ ansible_facts['distribution_release'] }} stable"
        repo: "deb https://repos.influxdata.com/{{ ansible_facts['distribution']|lower }} bionic stable"
        state: present

    - name: Add Grafana Apt key
      apt_key:
        url: https://packages.grafana.com/gpg.key
        state: present

    - name: Add Grafana stable Apt repository
      apt_repository:
        repo: deb https://packages.grafana.com/oss/deb stable main
        state: present

One of the biggest advantage of Ansible is that I don’t really need to explain what the tasks* are doing 😇

At the time where I wrote this article, InfluxData (the company behind InfluxDB and Telegraf) are not providing sources for the version 20.04 of Ubuntu, that’s why I specified the bionic version to be used for now. I have left, in line 18, the right way to get the current version of Ubuntu through the Ansible Facts.

InfluxDB

The second Play is about installing and configuring InfluxDB. I will also check for database presence and create it if needed:

 1
 2
 3
 4
 5
 6
 7
 8
 9
10
11
12
13
14
15
16
17
18
19
20
21
22
23
24
25
26
27
28
29
30
31
32
33
34
35
36
- name: InfluxDB
  hosts: pi-tig
  remote_user: ubuntu
  become: true
  gather_facts: false
  tasks:
    - name: Install InfluxDB
      apt:
        update_cache: yes
        pkg: influxdb

    - name: Service started and enabled
      service:
        name: influxdb
        enabled: yes
        state: started

    - name: Wait influxdb service to be ready
      wait_for:
        timeout: 20 

    - name: Check database presence
      uri:
        url: "http://127.0.0.1:8086/query"
        method: POST
        body: 'q=SHOW DATABASES'
      register: response

    - name: Create database
      uri:
        url: "http://127.0.0.1:8086/query"
        method: POST
        body: 'q=CREATE DATABASE "{{ influxdb_dbname }}"'
      register: response
      changed_when: response.status == 200
      when: "influxdb_dbname not in response.json | json_query('results[0].series[0].values[*][0]')"

I am not using the Ansible InfluxDB modules because they do not seem maintain anymore, the last supported version is 1.2.4 and we are now using the 1.8 version! We are using the Rest API instead which mean we don’t need any additional python library to be installed.

Telegraf

Telegraf installation and configuration:

 1
 2
 3
 4
 5
 6
 7
 8
 9
10
11
12
13
14
15
16
17
18
19
20
21
22
23
24
25
26
27
28
29
30
31
32
33
34
35
36
37
38
39
40
- name: Telegraf
  hosts: pi-tig
  remote_user: ubuntu
  become: true
  gather_facts: false
  tasks:
    - name: Install Telegraf
      apt:
        update_cache: yes
        pkg: telegraf

    - name: Service started and enabled
      service:
        name: telegraf
        enabled: yes
        state: started

    - name: Copy the telegraf configuration file
      copy:
        src: "files/telegraf.conf"
        dest: "/etc/telegraf/telegraf.conf"
        mode: 0644 
        force: yes
      notify: restart telegraf

    - name: Copy covid19 data CSV file
      copy:
        src: "{{ item}}"
        dest: "/tmp/covid19.csv"
        mode: 0644 
        force: yes
      with_fileglob:
        - "files/donnees-hospitalieres-covid19-*.csv"
      notify: restart telegraf      

  handlers:
    - name: restart telegraf
      service:
        name: telegraf
        state: restarted

Here we are copying the Telegraf configuration file alongside the data file. The CSV data transformation is explained inside the configuration file.

Once Telegraf have sent the data into InfluxDB, you can safely stop and disable the service. If you don’t, it will try to send them again each 5min (which can be convenient for update)

Grafana

Then we install Grafana and we can import the dashboard:

 1
 2
 3
 4
 5
 6
 7
 8
 9
10
11
12
13
14
15
16
17
18
19
20
21
22
23
24
25
26
27
28
29
30
31
32
33
34
35
36
37
38
39
40
41
42
43
44
45
46
47
48
49
50
51
52
53
54
55
56
57
58
59
60
61
62
63
64
65
66
67
68
69
70
71
72
73
74
75
76
77
78
79
80
81
82
83
84
85
86
- name: Grafana
  hosts: pi-tig
  remote_user: ubuntu
  become: true
  gather_facts: false
  tasks:
    - name: Install Grafana
      apt:
        force_apt_get: yes
        update_cache: yes
        pkg: grafana

    - name: Grafana started and enabled
      service:
        name: grafana-server
        enabled: yes
        state: started

    - name: Wait grafana-server service to be ready
      wait_for:
        timeout: 15 

    - name: Check datasource presence
      uri:
        url: "http://127.0.0.1:3000/api/datasources"
        method: GET
        force_basic_auth: true
        user: admin
        password: admin
      register: response

    - name: Create datasource
      uri:
        url: "http://127.0.0.1:3000/api/datasources"
        method: POST
        force_basic_auth: true
        user: admin
        password: admin
        body_format: form-urlencoded
        body:
          name: "{{ grafana_datasource }}"
          type: "influxdb"
          url: "http://127.0.0.1:8086"
          access: "proxy"
          basicAuth: "false"
          database: "{{ influxdb_dbname }}"
      when:
        - "grafana_datasource not in response.json | json_query('[*].name')"

    - name: Transfer dashboard provisioning configuration file
      template:
        dest: "/etc/grafana/provisioning/dashboards/dashboards.yml"
        src: "dashboards.yml.j2"
        mode: 0644 
        force: yes
      notify: restart grafana

    - name: Create a dashboard directory
      file:
        path: "/var/lib/grafana/dashboards"
        state: directory
        mode: '0755'

    - name: Transfer dashboard JSON files
      template:
        dest: "/var/lib/grafana/dashboards/{{ item }}"
        src: "files/{{ item }}"
        mode: 0644 
        force: yes
      loop: "{{ grafana_dashboards }}"
      notify: restart grafana

    - name: Set the correct datasource name in the dashboard
      replace:
        dest: "/var/lib/grafana/dashboards/{{ item }}"
        regexp: '"(?:\${)?DS_[A-Z0-9_-]+(?:})?"'
        replace: '"{{ grafana_datasource }}"'
      changed_when: false
      loop: "{{ grafana_dashboards }}"
      notify: restart grafana

  handlers:
    - name: restart grafana
      service:
        name: grafana-server
        state: restarted

Playbook execution

First, we get the sources:

1
git clone https://github.com/plop-bzh/ansible-tig-on-rpi

Then we can run the Playbook:

1
ansible-playbook playbook.yml -i inventory.ini -K

And we can reach the Grafana interface: http://IPRASPBERRYPI:3000/d/SQfyoqqZz/covid19-france-hospital-statistics?orgId=1, with the default credentials admin/admin.

Conclusion

I think it’s a good start if you want to work with the TIG Stack as well as a practical application of Ansible.

Hopefully it will help some of you!

Share on